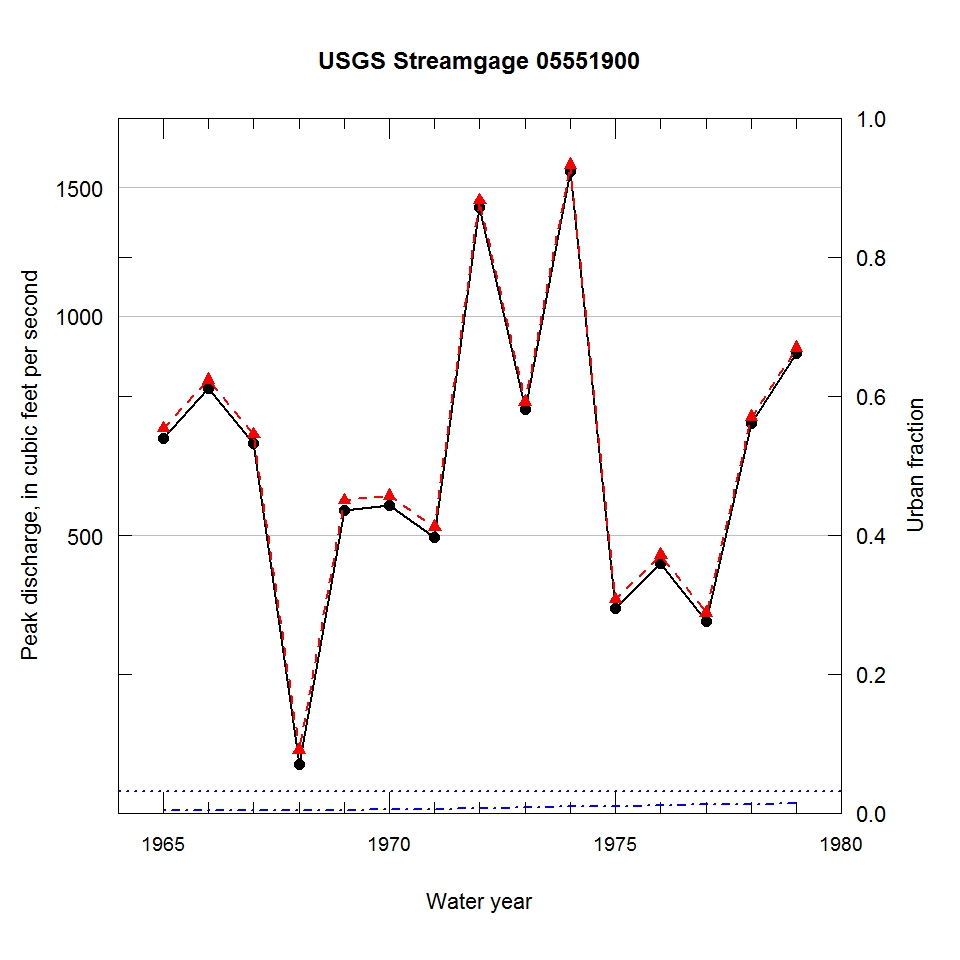
Observed and urbanization-adjusted annual maximum peak discharge and associated urban fraction and precipitation values at USGS streamgage:
05551900 EAST BRANCH BIG ROCK CREEK NEAR BIG ROCK, IL


| Water year | Segment | Discharge code | Cumulative reservoir storage (acre-feet) | Urban fraction | Precipitation (inches) | Observed peak discharge (ft3/s) | Adjusted peak discharge (ft3/s) | Exceedance probability |
| 1965 | 1 | -- | 0 | 0.004 | 0.079 | 680 | 701 | 0.507 |
| 1966 | 1 | -- | 0 | 0.004 | 0.481 | 795 | 818 | 0.397 |
| 1967 | 1 | -- | 0 | 0.004 | 1.113 | 668 | 688 | 0.520 |
| 1968 | 1 | 2 | 0 | 0.004 | 1.332 | 243 | 254 | 0.921 |
| 1969 | 1 | -- | 0 | 0.004 | 0.110 | 542 | 559 | 0.657 |
| 1970 | 1 | -- | 0 | 0.005 | 1.458 | 550 | 567 | 0.649 |
| 1971 | 1 | -- | 0 | 0.006 | 0.378 | 498 | 514 | 0.704 |
| 1972 | 1 | -- | 0 | 0.007 | 1.080 | 1410 | 1440 | 0.100 |
| 1973 | 1 | -- | 0 | 0.008 | 1.480 | 744 | 763 | 0.446 |
| 1974 | 1 | -- | 0 | 0.009 | 1.329 | 1580 | 1610 | 0.072 |
| 1975 | 1 | -- | 0 | 0.010 | 0.844 | 398 | 409 | 0.802 |
| 1976 | 1 | -- | 0 | 0.011 | 1.095 | 458 | 470 | 0.749 |
| 1977 | 1 | -- | 0 | 0.012 | 0.141 | 382 | 392 | 0.818 |
| 1978 | 1 | -- | 0 | 0.013 | 1.389 | 713 | 727 | 0.480 |
| 1979 | 1 | -- | 0 | 0.014 | 0.353 | 889 | 904 | 0.335 |

